
The Agile Project Management E-Mail Advisor, is a weekly electronic briefing from Cutter Consortium's Agile Project Management Advisory Service. It is written by Jim Highsmith, Director, Agile Project Management Practice.
"... Two things struck me about De Luca's keynote address and half-day workshop at the conference. First, his focus on the people aspects of project management, and second, the simplicity and power of the "Parking Lot" for planning and monitoring large projects. The Parking Lot will be the focus of this Advisor..."
The full e-mail advisor is reproduced here [nebulon.com] with the permission of the Cutter Consortium.

Visual Inspection
Nice article. I just wanted to add a few comments... One aspect of using Parking Lot diagrams is that it gives you a "big picture" of progress, but it actually comprises a few dimensions or levels of information.
It is most effective IMHO when you print out the entire project, and stick it on the wall (preferrably near the dev team). You notice several things.
Top-level state: The colour coding (white=not started, blue=in progress, green=complete, red=overdue) means that you can stand back from the wall, and instantly recognise the state of the project in a single glance. The brain can very quickly inspect by colour, and the primary colours used make this very easy - no reading and little processing required. A predominance of alarming red indicates a problem, while cool green/blue or neutral white indicates normalcy.
Hotspots: Since related parking lots are grouped together, there is a spatial correlation between areas. So clusters of colour tend to be very noticeable, and quickly highlight problem areas worthy of further attention. Similarly, chunks of green are very satisfying to the customer, as this is a bold indication of solid progress.
Spatial Progress: The first level of recognition is the colour for the status, and this gives a very coarse-grained view of progress. The next level is the actual progress bar showing percentage complete. This too can be inspected visually, since the progress bar spatially encodes completion (and this is a true measure of completion of working features).
Area Detail: the next level of detail is the name, feature count, the coarse time estimate, and numeric percent complete measure. (The fine-grained detail is captured in the feature charts.) So in terms of visual inspection, you can "zoom in" to more detail by stepping closer to the wall chart, to read detail instead of recognise colour or shape.
Encapsulation: Each parking lot encapsulates a whole bunch of detail about the features within, and exposes only the essential attributes at this level.
Inspection: The chart is easily understood, without complex notation, enhancing the recognition vs cognition aspect. Little training required.
Visibility: The project state is visible to any passer by, so when working on-site this level of visibility is very valuable to the customer. It also serves as a reminder to the developers! So this is a very effective tool for visual representation, communication, planning, and risk management, both for the customer and for the dev team.
There's probably more than this too, but that's all I can think of on the first coffee of the day.
ciao -
:: Gavin Baker -- http://antonym.org/
Some Examples
Nice post Gavin. To make it a little easier to follow I uploaded two examples. This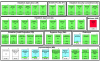 is a parking lot chart and this
 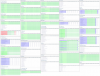 is the features in plan view pasted on the wall.